Australia does not publish a clean 30-year count of which occupations are held by people in the top 1% of earners. The available evidence does answer two useful questions: which occupation groups show the strongest high-income signal in recent tax data, and how employment in those groups has changed since 1996.
The key distinction is that the Australian Taxation Office (ATO) reports taxable income and salary-or-wage income separately. They are not interchangeable. The ABS and Jobs and Skills Australia (JSA) count people employed in occupations; they do not count how many in each occupation fall within the top 1% of incomes.
The top 1% is an income band, not a job title
In the latest ATO individual statistics for 2023–24, the top 1% taxable-income band begins at $429,531. That is not a salary threshold. Taxable income and salary-or-wage income are reported as different measures, and the ATO notes that the 2023–24 returns had been processed through 31 October 2025 and may not be complete.[1] [2]
The occupations below are six groups that featured among the ATO’s highest occupation averages in its 2022–23 summary, checked against the more detailed 2023–24 occupation tables. They are not the full list of ways Australians reach the top 1%.[3] [14]
The clearest signal is among anaesthetists. Their 2023–24 median taxable income was about $457,000, above the national $429,531 top-one-percent boundary. The ATO recorded 3,735 individuals in this occupation group. Because the group median is above the boundary, at least half of these tax records sit above that taxable-income threshold. But the median salary-or-wage income was about $235,000. That gap is a reminder that a high taxable-income figure is not the same thing as a high salary.[2] [3]
For surgeons, average taxable income was about $520,000, but the median was about $403,000. The median salary-or-wage figure was about $200,000. The mean above the cutoff signals a high-income upper tail, but the median below it means we cannot say that most surgeons are in the top 1%.[2] [3]
The other four groups show a broader range of outcomes. In 2023–24, the ATO’s average and median taxable incomes, followed by median salary-or-wage income, were approximately:
- Financial dealers: $347,000 / $187,000 / $175,000. The ATO recorded 5,148 individuals.
- Mining engineers: $216,000 / $187,000 / $176,000. The ATO recorded 10,619 individuals.
- Judicial and other legal professionals: $217,000 / $141,000 / $121,000. This is a specific ANZSCO group, not everyone working as a lawyer. The ATO recorded 4,338 individuals.
- Chief executives and managing directors: $200,000 / $94,000 / $80,000. The ATO recorded 237,168 individuals.[3]
These are occupation-coded tax records, not Labour Force Survey headcounts. ATO’s occupation-by-income-range table groups everyone above $180,000 into one broad tax bracket. That is too wide to count precisely how many in each occupation are above the $429,531 top-one-percent boundary. The detailed occupation tables also begin in 2010–11, rather than 1996.[1] [4]
How many people work in these occupations?
To compare the long run, I averaged the ABS’s four quarterly occupation estimates for each calendar year. The figures below are approximate employed people whose main job was in that occupation group. They are not vacancies or the number of top-one-percent earners. The same ABS EQ08 series reports ANZSCO occupation groups back to 1986; these are survey estimates, so small groups can move noticeably between quarters.[5]
- Chief executives and managing directors: about 24,000 in 1996 to 62,000 in 2025, roughly +160%. JSA’s latest available February 2026 trend estimate is 63,000, up 3,400 over the year.[7]
- Financial dealers: about 11,000 to 20,000, roughly +80% overall. The group peaked around 26,000 in 2006, then fell and partly recovered. JSA’s February 2026 estimate is 19,400, down 400 over the year.[8]
- Mining engineers: about 4,000 to 16,000, roughly +320%, the fastest growth among these six groups. JSA’s February 2026 estimate is 17,300, up 1,500 over the year.[9]
- Anaesthetists: about 2,500 to 7,200, roughly +190%. JSA’s February 2026 estimate is 7,400, up 200 over the year.[10]
- Surgeons: about 3,000 to 7,600, roughly +150%. JSA’s February 2026 estimate is 7,400, down 800 over the year.[11]
- Judicial and other legal professionals: about 5,400 to 13,300, roughly +150%. JSA’s February 2026 estimate is 14,500, up 800 over the year.[12]
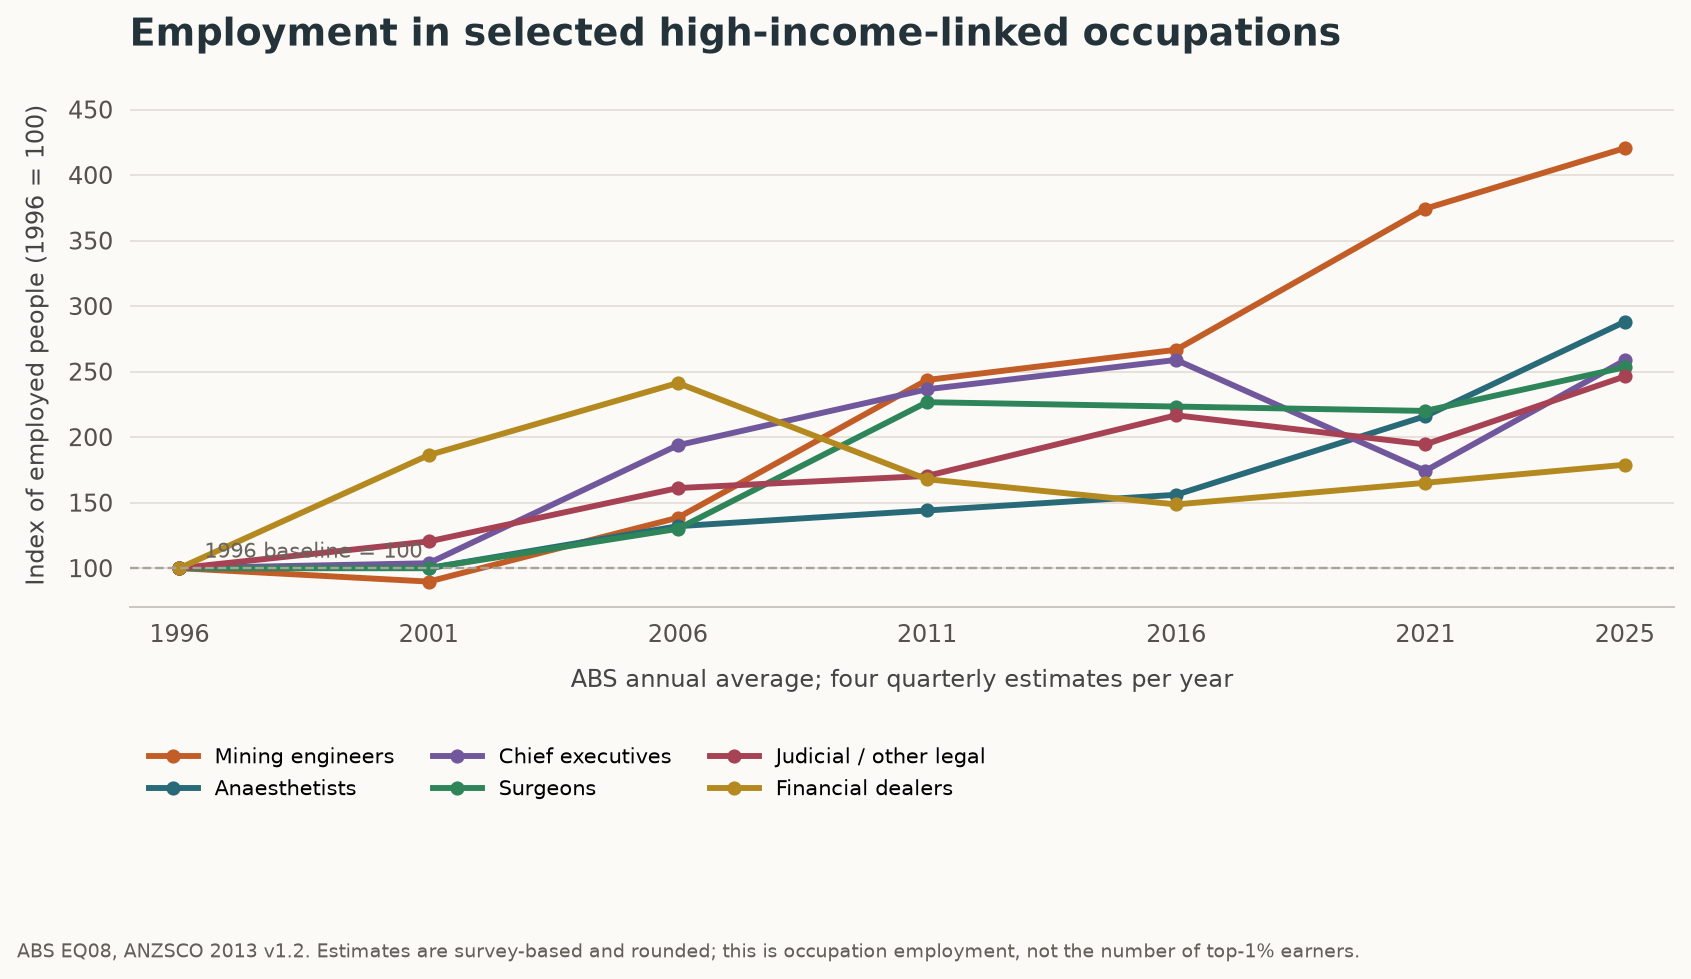
All six groups had more people employed in 2025 than in 1996 in this ABS series, but none followed a perfectly smooth path. The strongest expansion was in mining engineering. Financial dealing is the clearest example of a high-income-linked occupation that grew overall but remains below its mid-2000s employment peak. The latest February 2026 JSA figures show year-on-year growth in four groups and contraction in two: surgeons and financial dealers.
That is evidence about the size of the occupations, not evidence that the number of top-one-percent earners in them grew at the same rate. A group can add workers without adding top-end earners, and pay can rise or fall without the occupation’s headcount moving in the same direction.
What we can reasonably conclude
Specialist medicine is the strongest current high-income signal in this selected group of occupations. Anaesthetists’ median taxable income sits above the latest national top-one-percent boundary; surgeons have a very high mean, but a lower median. Financial dealers are another high-income group, while mining engineers, some legal professionals and executives include high earners alongside a much broader spread of incomes.
Over the past 30 years, the employment base of all six groups has expanded, particularly mining engineering. That does not tell us exactly what share of the top 1% held each job. Public ATO occupation ranges are too broad to make that count, and the detailed occupation-income series do not reach back to 1996.
There is also a classification change to keep in view. JSA’s February 2026 ANZSCO profiles are the latest published occupation-specific trend figures available in this check. JSA says ANZSCO profiles will no longer be updated and that a refreshed OSCA occupation suite is planned for November 2026. The ABS has moved Labour Force occupation reporting to OSCA from the September 2026 reference period and says OSCA estimates have been backcast from 2014, with earlier periods still being developed. That means future occupation counts will need care when compared with the older ANZSCO series.[6] [13]
References
- [1] ATO individual statistics for 2023–24
- [2] ATO percentile distribution of taxable income for 2023–24
- [3] ATO occupation averages and medians for taxable income and salary or wages
- [4] ATO occupation income ranges from 2010–11 to 2023–24
- [5] ABS EQ08 employed persons by occupation unit group from August 1986
- [6] Jobs and Skills Australia occupation profiles and data update notes
- [7] Chief executives and managing directors occupation profile
- [8] Financial dealers occupation profile
- [9] Mining engineers occupation profile
- [10] Anaesthetists occupation profile
- [11] Surgeons occupation profile
- [12] Judicial and other legal professionals occupation profile
- [13] ABS Labour Force Survey occupation classification changes
- [14] ATO occupation average taxable income ranking for 2022–23